GEODATA & GEOVISUALISATION

Water Resource Mapping| GIS VS Remort Sensing
April 27, 2018
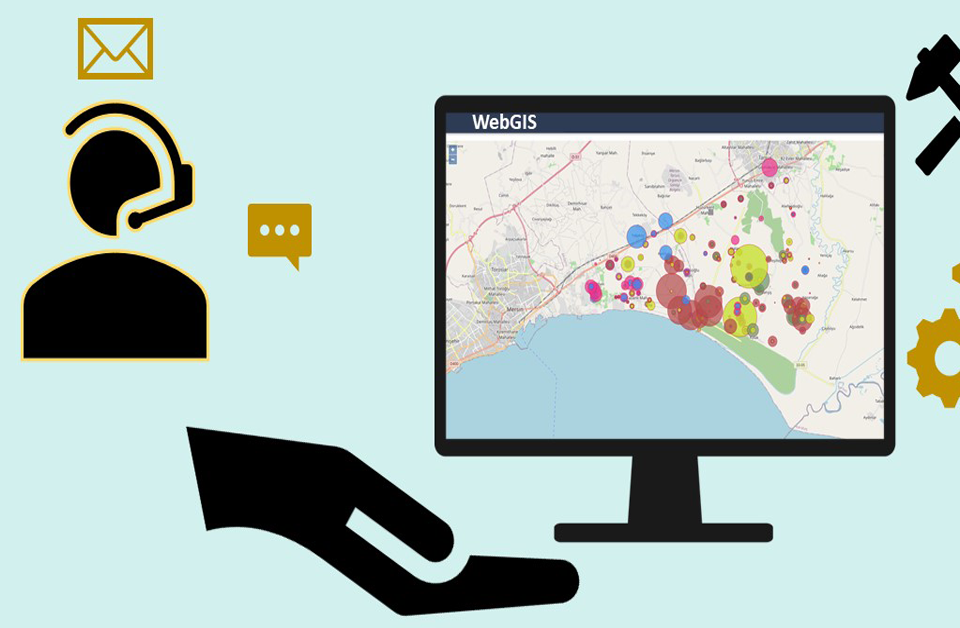
WeBGIS-The Revolution GIS
April 28, 2018
Why GEO-DATA?
Geodata is a compound word coming from geography and data. It is a technical term, a bit difficult to understand, which created for the sake of brevity. No matter how much technical term it is, however, separating the word in its two synthetics we can easily realize what it is about. So geodata in simple words is data which contain spatial information or geographic locations. These data are usually stored in GIS software in order to get analyzed, edited and visualized. Visualizing geodata gives us the ability to create interactive maps with extreme details and applications in many innovations and surveys.
The Main Types of GEO-Data:-
Geodata is divided into two main categories. The raster and vector data which are referred to spatial information. In this article, we will analyze the usage and the way vector and raster data get visualized on GIS software.
-
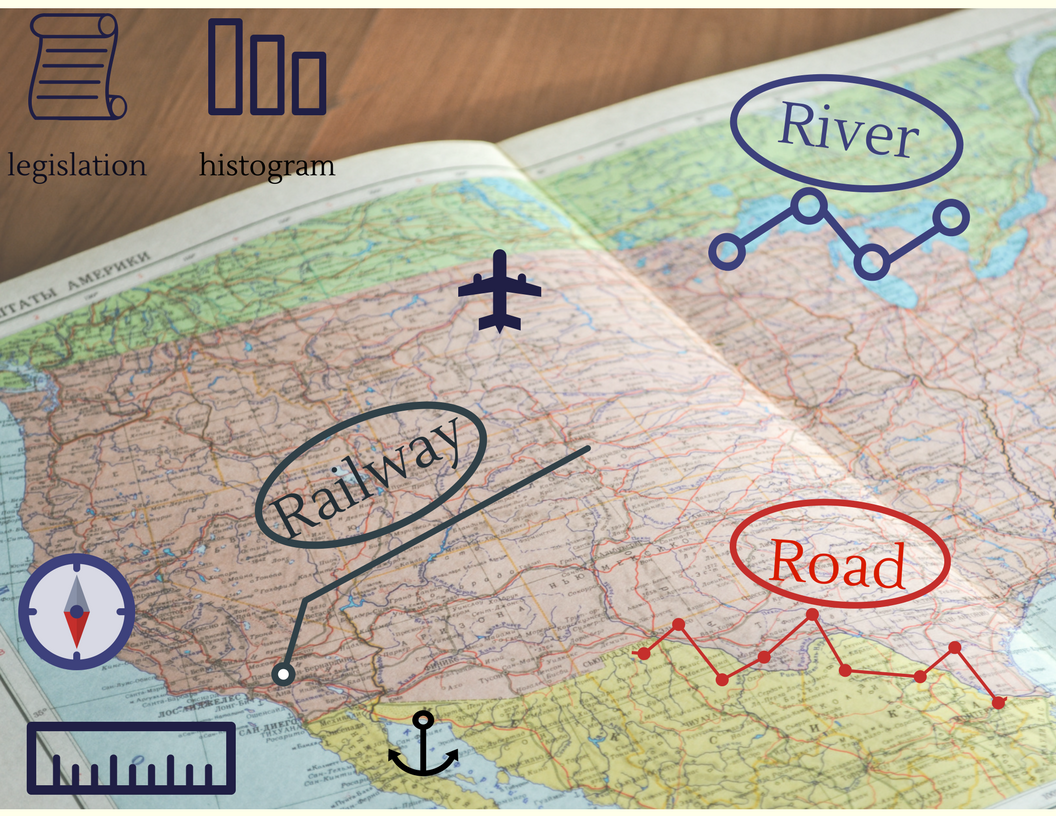
Vector Geodata consisted of vectors which encompass an area, a road, a house or everything else a map shows, with the corresponding attribute. More specifically, with the polygon vector which is a two-dimension feature, we can orb an agriculture area or a neighbourhood or a forest etc. After delineating with the polygons, we create the attribute table with details such as the name of the neighbourhood, for example, the population, and other characteristics, while we can measure perimeter. The line helps us digitize roads usually, or rivers or rails and give names and lengths on the attribute as it only has one dimension. On the other hand, the point feature is useful to depict schools or churches or whatever is shown as a point in a map. It has no dimension, so we can’t have measurements such as length or perimeter but only the name of the point.
-
Raster Geodata contains a grid where each cell consisted of value, gives information such as temperature or color and represent the surface. The whole grid results in a map or image. The use of raster geodata in GIS can be divided into 4 categories:
- Raster as a Base Map: the background where we are going to work on.
- Raster as a surface map: raster geodata represent surfaces that change easy. Elevation values, rainfall, population density etc. can easily be analyzed
-
Raster as a thematic map: Thematic maps may show land-cover or suitability for an activity and raster geodata are ideal for this process.
-
Raster as an attribute of a feature: It is a separate layer which includes a picture or a document or additional information about a feature in a map.
There are many reasons why we should store geodata as a raster such as the simple data structure, the ability for advanced spatial and statistical analysis, uniformly storage of points, lines, polygons, and surfaces, performing fast overlays with complex data sets etc.
To conclude, in GIS the difference between those two categories of geodata relies on the way each of them represents spatial data.
What Else After Geodata? GEO-Visualisation
BASIC STEPS FOR GEOVISUALISATION OF GEODATA
Geovisualisation is a set of tools, techniques and cartographic technologies, supporting the analysis of geodata. This process describes the effort people overpower to place the geodata in a visual context so that to understand their significance and draw conclusions. Therefore, the emphasis is given on the field of data construction in such way to becoming comprehensible. Some of the applications where geo-visualization is extremely useful are in the wildland firefighting, in forestry, in urban planning and generally in environmental studies.
Essentially, geo-visualization gives the opportunity to create a map of a catchment area with all its natural characteristics originated from geodata and combined in layers. The interactive map is the latest evolution of science, the result of the development of geo-visualization, with maps which change colors without human intervention in order to show the progress of different features in an area.
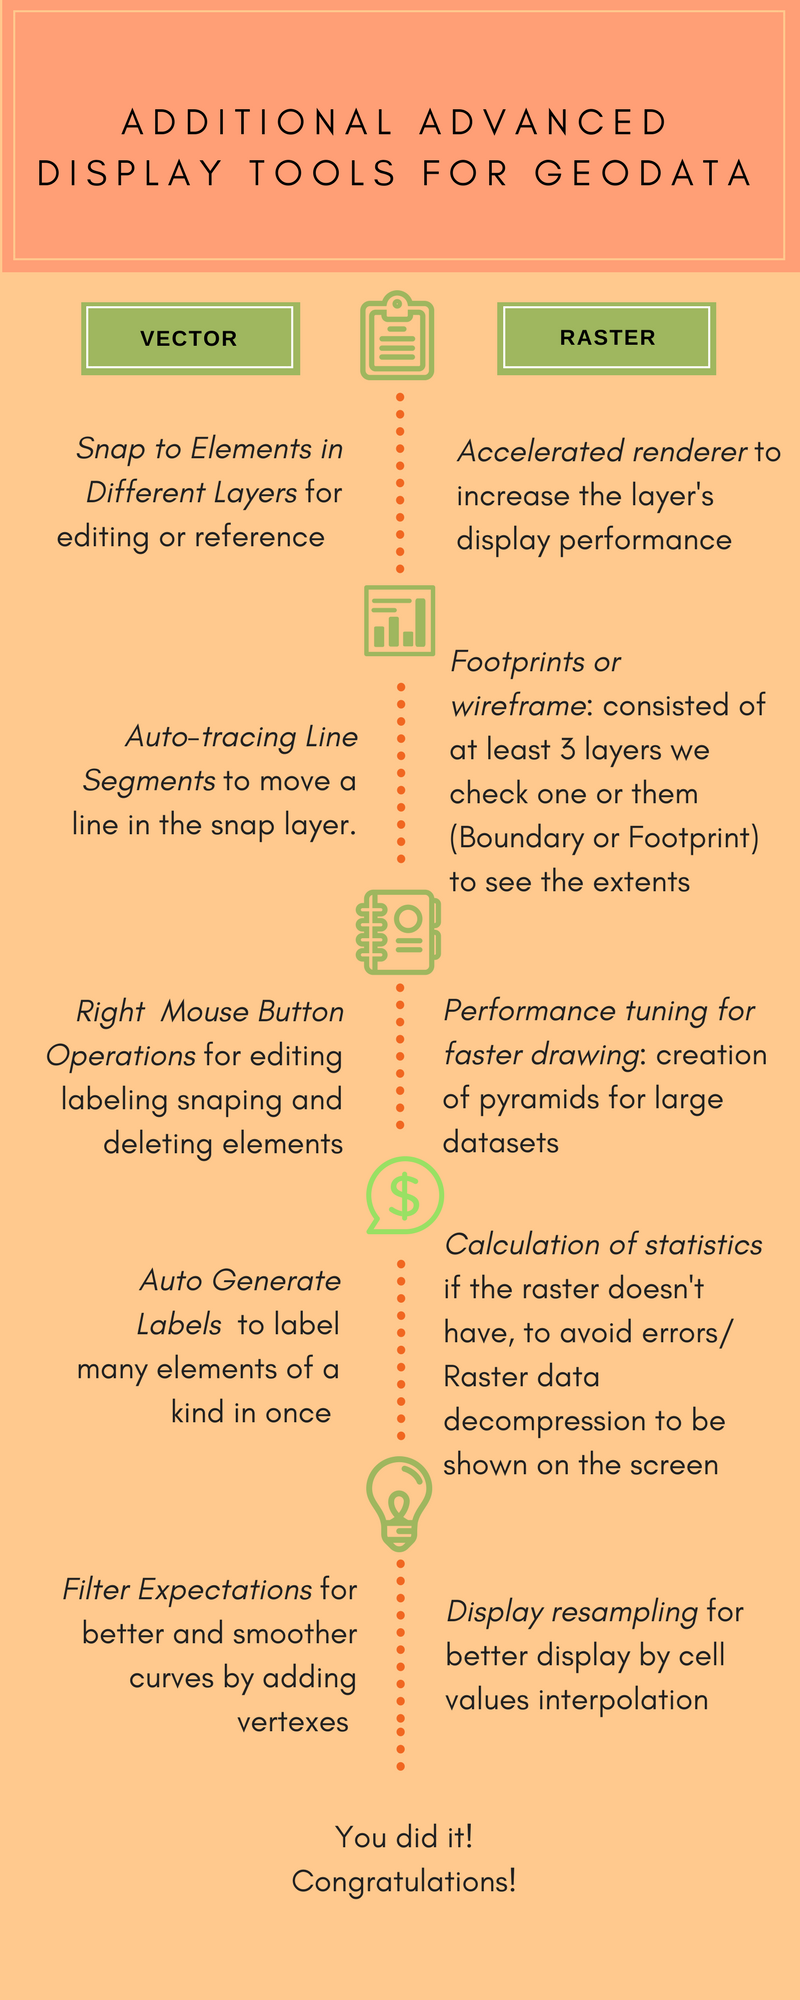
ArcMap toolset of GIS provides tools which offer faster drawing, enhancement of the image, and retention of the statistical dataset. We will see some of them below.
Basic Steps for Geo-Visualization of Geodata
-
Regarding the vector geodata, the first thing we should do is to add a reference layer with valid geographic coordinates on which the above layers will be based, as it is very important for our map to be placed in the right geographic location. Before starting to draw on the layer we need to define the color and the thickness of the lines so that to be sure that the schemes will be visible on the map. We should also be aware of the units. Furthermore, we proceed with the add line tool which allows us to start drawing paths, rails etc. Lines, however, are not the only elements. There are also points and polygons which can be either in the same vector object or in a Vector toolset gives us many advantages such as changing modes from draw to stretch in order to remove overshoots, drag the line in another vertex or move a segment to align with the reference layer Completing the drawing we should work on the attribute table by inserting information, labels, and colors which is the most important part of the visualization.
-
The process we follow on raster geodata is almost the same with the vectors. The difference relies on the fact that we use raster tools which have the same function with the vector tools and that when we draw on a raster file the cell values take new values from the line color.
To conclude, raster and vector geodata have crucial meaning for earth’s evolution. Both include geographical and spatial information, helping us visualize, predict and prevent phenomena. They are treated in almost the same way, nevertheless, the result is unique for each of them as well as the conclusions we export.
For more information about geodata, geo-visualization and GIS techniques, you can contact UIZ Company with a call at +49-30-20679130.


