Vector Data Capture

Machine-Readable Application Maps Using GIS and Geodata
October 1, 2017
GIS Mapping and GIS Maps Uses
October 23, 2017
Vector Data is one of the ways to provide detailed information for GIS environment in a way to represent real-world features. A feature is anything which can be seen on a landscape including houses, rivers, lakes, farms, roads and more. In GIS Applications, all these would be distinctive features and therefore would need to be differentiated and identified and vector data capture suite better. The vector features have geometry as well as the attribute. The attribute pinpoints the feature while the attribute is a piece of text or numerical information describing the feature.
Vector data geometry usage
A feature’s geometry can be of only a single vertex, two vertices or more vertices. A vertex in simple language means a point which could be formed by either one coordinate, two coordinates or three coordinates depending on the used system among one-dimensional, 2D or 3D namely; ‘X’, ‘Y’ and ‘Z’. In most cases – for GIS mapping – when all the X, Y and Z are used, it is referred to as 2.5D rather than 3D because together with latitude and longitude is either depth or length expressed but not with both. A feature which is represented by only one vertex is called a point feature while if the feature is represented by two or more vertices but the first and last vertices are not equal then that will be a polyline feature. On the contrary to the previous situation, if the first and last vertices are the same then and enclosed polygon will be the feature represented.
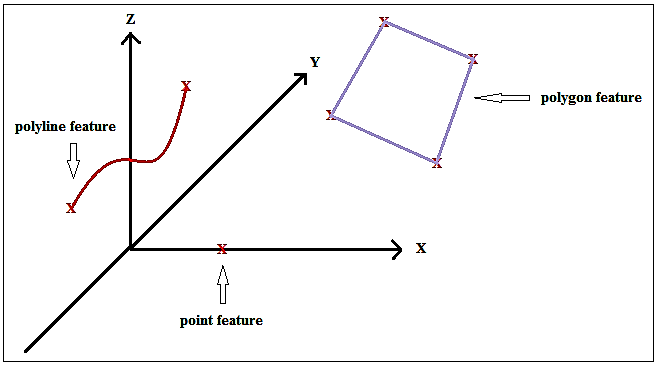
Figure1: Vector Data Feature’s Geometry
The Figure1 above demonstrates the different features represented in 3D vector geometry. As seen above, the maroon polyline is formed by two vertices, the blue polygon is formed by four vertices while the red point is formed by one vertex. These features can be used in different ways for different purposes depending on different areas depicted for GIS and on the scale used. For example in a rural setting, polygons could be used for farms while in urban setting the polygons could be used for infrastructures. And the same goes for scales.
Vector data Attribute and Symbology
The advantage of using vector data for GIS is that it carries more information on the map. Having already seen the geometry part, the other essential part is the attribute which explains more about the feature in text. This usually goes hand in hand with the symbol used and the colors used for the features.
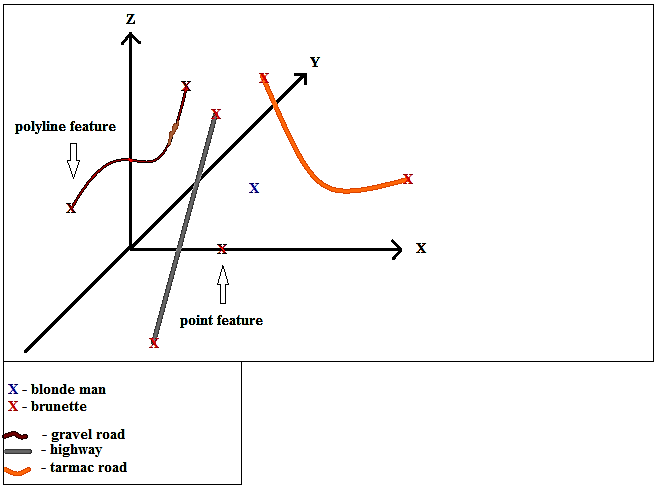
Figure2: Vector Data Feature’s Attributes
The above Figure2 portrays the features used in the GIS but under it is the attribute section which gives meaning to the features shown on the map, for example, the blue ‘X’ stands for a blonde man or could even stand for the blonde population while the orange ‘X’ stands for the brunette population. Likewise – for the roads – different colors, shades, width of the polylines could all portray different roads which would be described in the attribute section of the GIS.
Vector Data Capture
Geographic Data Capture is the process of collecting geographic data for various purposes including GIS Application development. There are mainly two ways of data capture which are Raster data capture and Vector data capture while the latter is the focus of this article. The data capture is done in two phases; the Primary geographic data capture and the Secondary geographic data capture.
Primary geographic vector data capture
The two main ways for primary vector data capture are ground survey and GPS while the clear distinction between the two types is blurring increasingly. The ground survey will be discussed first then move on to GPS or in other terms, the LiDAR.
1. Ground Surveying
Ground survey is the best way to obtain the accurate point locations despite the setbacks; time-consuming requires highly expert professionals as well as it is very expensive to carry out. The principle behind surveying is that an unknown point can be determined by measuring the distance and angles from a reference known point. The traditionally used equipment; Transit and Theodolites are currently replaced by the Total stations that measure distance and angle at an accuracy of 1mm. Ground survey is typically used for capturing buildings, property boundaries and other features that require accurate positioning. It is very useful and provides a foundation for other types of data capture.
2. LiDAR
Standing for Light Detection and Ranging is a relatively newer technology for remote sensing method that uses light in the form of a pulsed laser to measure ranges for accurate topographic surveys. LiDAR is mostly placed on a low-altitude aircraft having an inertial navigation system but also a differential GPS to provide a location.
Secondary geographic vector data capture
The secondary vector data capture involves working on digitizing vector objects from maps and other geographic data sources.
1. Digitizing and vectorization
Vectorization is the conversion of raster data to vector data. The most common and simplest way is to create vectors from raster data is by digitizing vector objects manually on a computer using the mouse or digitizing cursor.
2. Measurement error in vector data capture
There are possible errors which could occur in the primary phase of data capture, for example, overshooting, undershooting, invalid polygons, silver polygons and any other normal human errors. The other errors may occur, arise by the use of rubber sheeting which assumes that spatial autocorrelation exists among errors. These errors should be addressed and corrected at this stage.
3. Photogrammetry in GIS
This is a 3-dimensional coordinate measuring technique fundamentally using photographs. The basic principle applied in photogrammetry is called Aerial triangulation. Aerial triangulation means taking photos from at least two points on the object or surface. There are two fundamental photogrammetry processing tasks which are orientation and triangulation.
4. COGO vector data entry
COGO stands for coordinate geometry which is a method for capturing and representing geographic data using survey-style bearings and distances to define each part of an object. COGO data are very precise measurements that they are regarded as the only legally accepted definition of land parcels.
Capturing attribute data
Attributes, as explained before, are the second essential part of the vector data representation to complete the meaning of the feature. Attributes could be entered directly by data loggers, using a keyboard, optical character recognition or voice recognition as it is increasingly being applied recently in GIS. The essential requirement for separate data entry is a key which relates the attribute of a feature to its geometric information which completes the process of vector data capture.
For more information about data capturing techniques please contact us at +49-30-20679115.

