If you are looking for a way to improve your business, WebGIS is the best solution. We provide all the WebGIS functions that are going to help you in monitoring your marketing in a simple and interactive map. WebGIS converts data and graphics in a more intuitive map, in which it is easier to understand how your business is going.
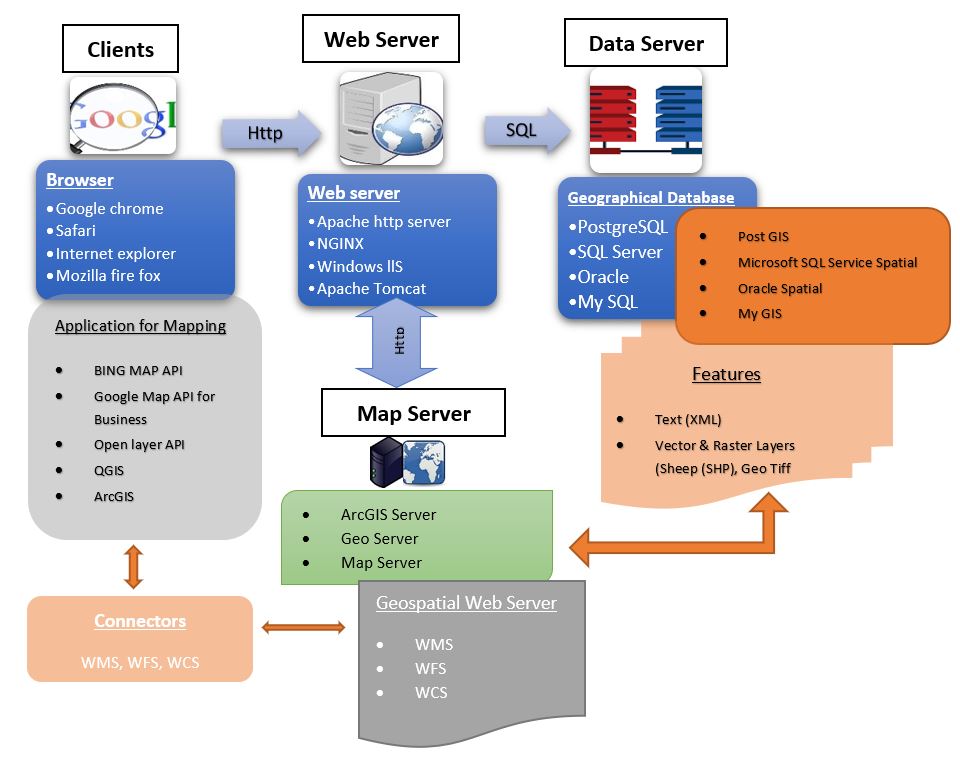
How can I implement WebGIS?
WebGIS functions:
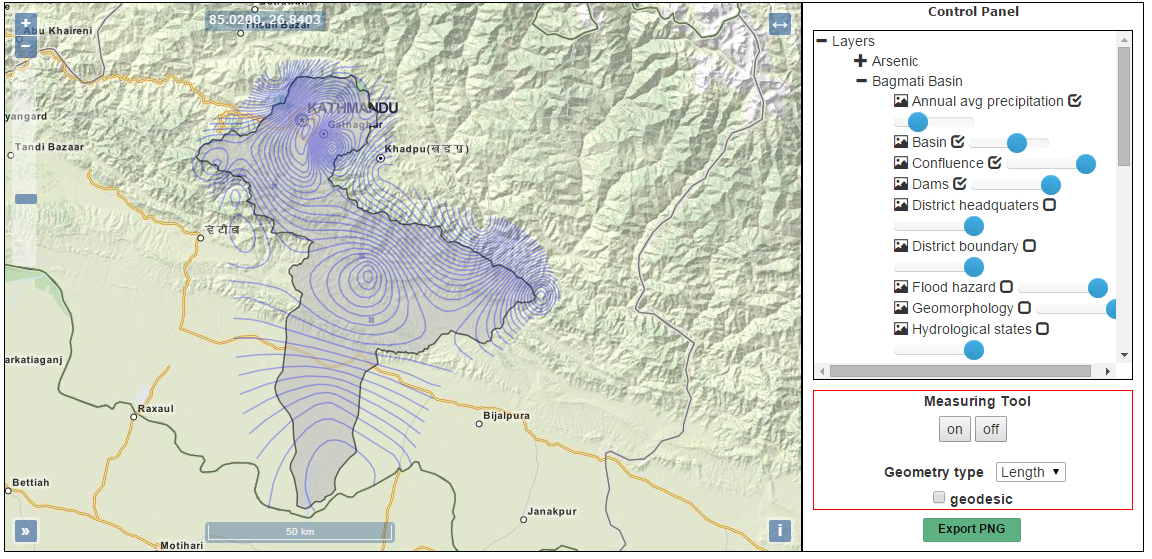
- Create the Map:
WebGIS offers interactive maps to display data from different databases. Thanks to data visualization, you will be able to know where your business is taking place and how well it is going in a specific area. The maps are interactive, thus you can set filters and constantly update them according to your needings. You also will be able to change scale, view or hide data and print the selected area.
WebGis Server
What kind of map does WebGIS provide?
- Customer: this map let you visualize locations of customers and analyze the distribution in a selected area.
- Branch: visualize the company branch locations on the map and view the dealers, partners, stores, warehouses and more.
- Sales: how is the business doing? You can realize a map in which analyze the sales figures globally or in a specific region.
- Competitor: Keep an eye on the competition and be always updated on the distribution of competitors close to your business.
- Data analysis: Data that is hidden in a map or not easy to understand only by visualization, are analyzed and carried out by WebGIS analyzing tools.
What informations are provided by WebGIS analyzing tools?
WebGIS collects the huge amount of data available for companies and selects the most important for your business and in the end shows them on the map.
WebGIS can give you information about spatial structures, infrastructures and kind of population. These factors may give you the chance for setting your business in a particular strategic area. WebGIS also shows you location-based relationships, such as traffic or physical barriers and compares this information with your company data.
One of the more important knowledge provided is the risk marketing analysis. WebGIS shows you the investment made in the planned location, the financial trends and analyzes scores and gravity to help you choose the best low risky investment. It also shows the possibly outliers present.
WebGIS runs your browser so you can check maps anytime. It offers tools for sharing information with colleagues and sending reports to superiors. This is going to make dialog and communications easier. All the tools available will help you in decision making and maintain your overview. Both for employees and superiors the work is going to be more efficient and easier and the success of the company will improve rapidly.
GIS tools can be used to show geo relationships and linear networks. Spatial relationships may show topography, such as farming fields and streams. They may also exhibit land-use patterns, such as the location of parks and housing complexes.
Linear networks, sometimes called geometric networks, are frequently signified by roads, rivers, and public service grids in a GIS. A line on a map may indicate a road or highway. Geographical Information System needs to create the information from all the various maps and bases align, so they are suitable collected on the similar scale. A scale is the relationship among the distance on a map and the real distance on Earth. Often, Geographical Information System need manipulate data because diverse maps have unlike projections.
Did you know that 80% of data have spatial reference? You can visualize them on interactive maps, graphs and diagrams. You can easily capture any desired perspective on your data, whether you want to get an overview of your entire area of responsibility or have a close look at the fine details.on the interactive map you can zoom in or zoom out and set filters to check the information needed out.
Through geographical data visualization you can say a lot about the spatial structures of a city, region or area. Is a region densely or sparsely populated, a suburb or city center, an industrial or tourism region, with good infrastructure or poor roads, a university center or emigration region? You can make your own survey and investigate the population conditions. Extract data about wellness, employment, education, distribution and more.
